High/low crypto strategy with MACD/PSAR/ATR/EWaveToday I am glad to bring you another great creation of mine, this time suited for crypto markets.
MARKET
Its a high and low strategy, designed for crypto markets( btcusd , btcusdt and so on), and suited for for higher time charts : like 1hour, 4hours, 1 day and so on.
Preferably to use 1h time charts.
COMPONENTS
Higher high and lower low between different candle points
MACD with simple moving average
PSAR for uptrend and downtrend
Trenddirection made of a modified moving average and ATR
And lastly elliot wave oscillator to have an even better precision for entries and exits.
ENTRY DESCRIPTION
For entries we have : when the first condition is meet(we have a succession on higher high or lower lows), then we check the macd histogram level, then we pair that with psar for the direction of the trend, then we check the trend direction based on atr levels with MA applied on it and lastly to confirm the direction we check the level of elliot wave oscillator. If they are all on the same page we have a short or a long entry.
STATS
Its a low win percentage , we usually have between 10-20% win rate, but at the same time we use a 1:30 risk reward ratio .
By this we achieve an avg profit factor between 1.5- 2.5 between different currencies.
RISK MANAGEMENT
In this example, the stop loss is 0.5% of the price fluctuation ( 10.000 -> 9950 our sl), and tp is 15% (10.000 - > 11500).
In this example also we use a 100.000 capital account, risking 5% on each trade, but since its underleveraged, we only use 5000 of that ammount on every trade. With leveraged it can be achieved better profits and of course at the same time we will encounter bigger losses.
The comission applied is 5$ and a slippage of 5 points aswell added.
For any questions or suggestions regarding the script , please let me know.
In den Scripts nach "stop loss" suchen

2 Candles Inside ATR2 agitated candles falling inside ATR range, awaiting possibly a big move.
Buy / Sell signals at combined high / low can be used as order with other as stop loss.
Counter trade, when this minimal stop loss is hit, is also as useful. However, wait till the SL candle closes, before opening position on the other side.
Works quite well on 15 mins chart, with settings of ATR duration 25 and multiplier 0.6. These settings are configurable, so feel free.

Intraday Trend Following Algorithm [Bitduke]Description :
Trend following strategy that constantly adjusts to volatility and avoids of most whipsaws; rapidly moves up or down according to a quickly changing market. Great strategy for high volatile markets, like crypto market.
Based on a couple of special moving averages with integrated smoother which helps to avoid whipsaws.
Backtesting
Backtested on BTCPERP ( FTX ). It shows much better results on 4h timeframe (more than 222% YTD) and relatively low drawdown which allows you to use up to x3 leverage without a fear of huge losses. I.e if we have 5% drawdown for this strategy and using x3 leverage then to be prepared to 15% drawdown maximum in this case.
Initial Capital: $1000
Capital per trade: $1000
Including fee: 0.075% (buy + sell) side, type "taker"
When we get a signal (green/red column on chart) algo opens a trade by the next candle open price.
Others:
Risk management: Stop loss/Take profit in %
Strategy doesn't repaint .
----------
To access: sign up on FTX using ref link from my signature.

Lowkey System (Strategy)View study version
A long-only strategy that aim to detect the beginning of new bullish trends and their ends.
For entering a new position this script is waiting for a moving average crossover then wait for a volume increase relative to the current volatility.
For closing a position it's simply waiting for a crossunder of whether the MA or if enabled the stop loss.
This strategy is already configured to run on BTCUSD in a 4h timeframe but you can customize the moving average and the stop loss parameters to suit your needs.
I've worked a lot to write this script so I'm not giving it for free but you can try it for 10 days.
Contact me for more details.
Have fun!
PS: I'm french so please excuse me if I've made some grammar errors ;)

PD Crypto Performer PRO (Backtest)Description:
This is the backtesting version of the PD Crypto Performer Pro (Alert) . You can choose to backtest either one of the two strategies included, a trend-identifying swing strategy and a low risk scalping strategy. Both strategies assume the same capital amount invested ($10,000) each trade. You can also see how your capital grows over time by enabling the reinvesting proceeds option. For details, please check out this tutorial .
The backtesting results could be easily improved in live trading by utilizing the “Take Profit” signals and following the recommended methods of use below.
To assist the decision-making process, the code currently references BTCUSD. As a result, it is only suitable for crypto traders. However, we are working on the stock and forex versions, and the Performer will have these compatibilities soon.
Most importantly, our signals DO NOT REPAINT !
Recommended Use:
- Time Frame: 1HR
- Asset: Large cap crypto assets.
For lower risk tolerance, we recommend using the indicator on ETHUSD. For maximizing profits, we recommend using the indicator on BCHUSD.
- Always set stop loss according to your own risk tolerance
- Take profits along the way. Check out this video tutorial for when to reenter after our take profit signals.
Recommended Use for Advanced Traders:
- Position sizing:
Larger position if the 1HR signal is in the same direction compared to the 4HR trend.
Smaller position if the 1HR signal is in the opposite direction compared to the 4HR trend.
- Better entry/exit points:
Track the 1HR signal for the asset you are trading on other exchanges along with the BTCUSD 1HR signal. Sometimes, the signals from different exchanges occur with a 1-2 hour difference. You could use these earlier signals along with a lower time frame (eg. 15min) entry confirmation from your own exchange for better entry / exit points.
- Use “Take Profit” signals for counter trend scalps. Recover at the reentering opportunities . This works best with candlestick pattern confirmations.
Never use this if you suspect a flag / inverted flag pattern is forming.
Go to www.phi-deltalytics.com and sign up for a FREE trial today!
Let us know if you have any questions or recommendations. We are here for your success!
Disclaimer:
It should not be assumed that the methods, techniques, or indicators presented will be profitable or that they will not result in losses. Past results are not necessarily indicative of future results. This is not a solicitation of any order to buy or sell.

PD Crypto Performer (Backtest)Description:
This is the backtesting version of the PD Crypto Performer (Alert) . The strategy assumes the same capital amount invested ($10,000) each trade. You can also see how your capital grows over time by enabling the reinvesting proceeds option. For details, please check out this tutorial . The backtesting results could be easily improved in live trading by following the recommended methods of use below.
To assist the decision-making process, the code currently references BTCUSD. As a result, it is only suitable for crypto traders. However, we are working on the stock and forex versions, and the Performer will have these compatibilities soon.
Most importantly, our signals DO NOT REPAINT !
Recommended Use:
- Time Frame: 1HR
- Asset: Large cap crypto assets.
For lower risk tolerance, we recommend using the indicator on ETHUSD. For maximizing profits, we recommend using the indicator on BCHUSD.
- Always set stop loss according to your own risk tolerance
- Take profits along the way.
Recommended Use for Advanced Traders:
- Position sizing:
Larger position if the 1HR signal is in the same direction compared to the 4HR trend.
Smaller position if the 1HR signal is in the opposite direction compared to the 4HR trend.
- Better entry/exit points:
Track the 1HR signal for the asset you are trading on other exchanges along with the BTCUSD 1HR signal. Sometimes, the signals from different exchanges occur with a 1-2 hour difference. You could use these earlier signals along with a lower time frame (eg. 15min) entry confirmation from your own exchange for better entry / exit points.
Go to www.phi-deltalytics.com and sign up for a FREE trial today!
Let us know if you have any questions or recommendations. We are here for your success!
Disclaimer:
It should not be assumed that the methods, techniques, or indicators presented will be profitable or that they will not result in losses. Past results are not necessarily indicative of future results. This is not a solicitation of any order to buy or sell.

Directional Momentum Flux StrategyDirectional Momentum Flux (DMF) is a compound indicator designed to surface signals of projected change in directional momentum. The primary goal is to identify possible momentum inflection points and signal them before they happen, which is reached by applying a set of well-known high-level indicators (e.g. DEMA, RSIs, CCIs and VWAP), lower-level indicators (e.g. BOP, PPO and RMOMO), and some special sauce brewed in-house by yours truly.
This strategy is invite-only. Invitations are offered for a one-time fee of $250 payable in several cryptocurrencies (ETH, BTC, DASH, XMR or ZEC). Once you've got an invitation, you will automatically receive updates forever*.
DMF was designed to work across multiple asset classes. Extensive backtesting has been performed over multiple sample series (not just during the bull runs, for example) and against a randomized pool of assets. But don't take my word for it, I've included some time-based backtesting support tools to make it easy-peasy for you to validate the results yourself!
Under the hood, DMF is powered by numerous indicators, including:
✓ Double EMA & Composite SMA;
✓ Double RSI (fast & slow, variable);
✓ Composite StochRSI & VWAP (StochRSI+, two series);
✓ Composite Commodity Channel Index (CCI+, two series);
✓ Volume-Weighted Balance of Power (BOP itself was adapted from BOP_LB, kudos to LazyBear);
✓ Percentage Price Oscillator (PPO, split, two series);
✓ Range-adjusted Momentum Oscillator (RMOMO, my fancy MOM variant);
It crunches all that data and generates signals which are issued in two ways:
✓ Vertical Bands (or VBs) - Entry/Exit windows as vertical bands that remain "lit" (e.g. the background of a series of candles is semi-opaque white) while the top-level signals are showing sufficiently strong BUY signals. These windows are the primary entry/exit targets and can be relied upon with sufficient risk mitigation (e.g. a reasonable stop-loss or other scale-out exit mechanism). A VB followed immediately by an egg is as good as gold.
✓ Eggs - Entry/Exit validation signals that confirm the condition indicated by VBs. A lit VB without an egg in the same or next candle session is considered to be valid , but not safe (see above warning). Waiting for an egg can improve performance at the risk of missing the best possible entry point. Consider your risk tolerance and act accordingly.
Basic Instructions:
✓ Configure The Settings! The defaults are pretty good, but don't be scared to try variations. For example, by default SHORT positions are disabled. You might want to enable them if your risk tolerance allows them. (IMO there's gold on both ends of the rainbow. 🌈)
✓ Pay attention to the VBs. If you see a lit band being placed in an otherwise dark area, it's a projected inflection point. This is expected to be validated and confirmed in the same or immediately following period with an egg. You can enter a LONG position at this time.
✓ Pay attention to the eggs. If you see an egg, it's a confirmation that the VB changes in the same or immediately preceding candle period is valid. If you did not enter or exit your position at the point of the VB shift, now is the time to do so.
✓ Watch for the end of a VB period and be prepared to exit your position quickly as the next egg may be accompanied by a large directional momentum inflection.
Things to Note:
📉 - DMF is designed for day trading with aggressive position TTLs (15m was the upper bound during development and strategy testing). It appears to issue valid signals for other intervals, but it was not designed for >15m and YMMV. Don't go manually opening a LONG with no exit strategy and go to sleep... it probably won't work out to your benefit. You should be prepared to exit positions at any time. (Pro tip: automation is your friend!)
💸 - DMF indicator is not free from risk. As with all investment strategies, it is crucial to exercise caution and only trade with funds you are comfortable losing. DMF does not offer any form of guarantee or warranty, implied or otherwise. If you lose money, your house, your 401K... that's on you. (Pro tip: don't risk anything you're not ready to lose, because losses are part of the game and you WILL have them.)
🤔 - By using this indicator, you understand that any and all risks are the sole and complete responsibility of the end user (yeah, that's you). Don't use it if you're not 100% clear that you know exactly what you're doing. (Pro tip: always ask questions if you're feeling confused.)
⏱ - * Forever in this context means that, where room for improvement exists, I will improve it over time and you'll get all updates until I stop making them. (Pro tip: nobody lives forever.)

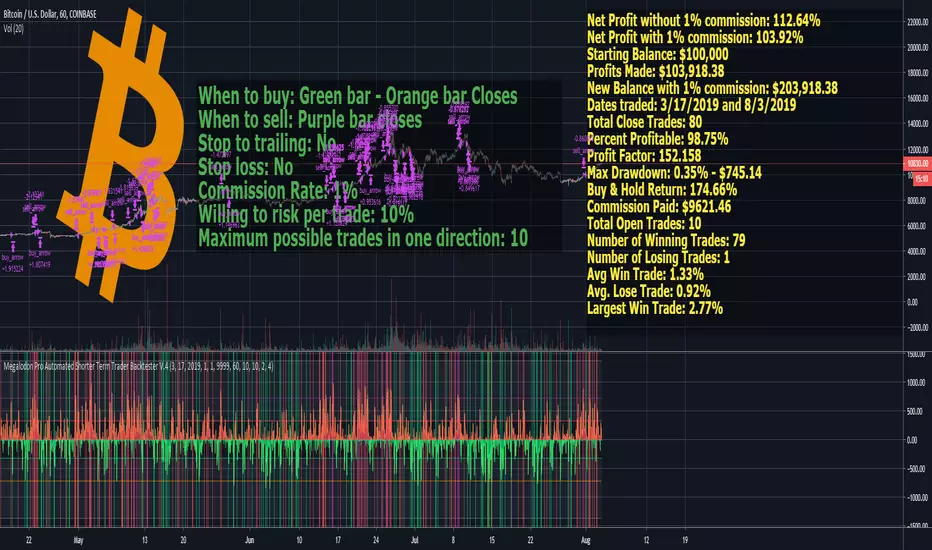
Megalodon Pro Automated Shorter Term Trader BacktesterSTRATEGY
When to buy: Green bar - Orange bar Closes
When to sell: Purple bar closes
Stop to trailing: No
Stop loss: No
Commission Rate: 1%
Willing to risk per trade: 10%
Maximum possible trades in one direction: 10
RESULTS
Net Profit without 1% commission: 112.64%
Net Profit with 1% commission: 103.92%
Starting Balance: $100,000
Profits Made: $103,918.38
New Balance with 1% commission: $203,918.38
Dates traded: 3/17/2019 and 8/3/2019
Total Close Trades: 80
Percent Profitable: 98.75%
Profit Factor: 152.158
Max Drawdown: 0.35% - $745.14
Buy & Hold Return: 174.66%
Commission Paid: $9621.46
Total Open Trades: 10
Number of Winning Trades: 79
Number of Losing Trades: 1
Avg Win Trade: 1.33%
Avg. Lose Trade: 0.92%
Largest Win Trade: 2.77%
Let me know what you guys think about the results?
Due to the tradingview's limitations on providing the shorter time frame price data, we had to provide a 60 minute time frame backtesting results.
The shorter time frames including 1 minute and 15 minutes backtesting results are way more accurate and precise than 60 minutes time frame results.
Megalodon Trading
Enlightening the Modern Investors
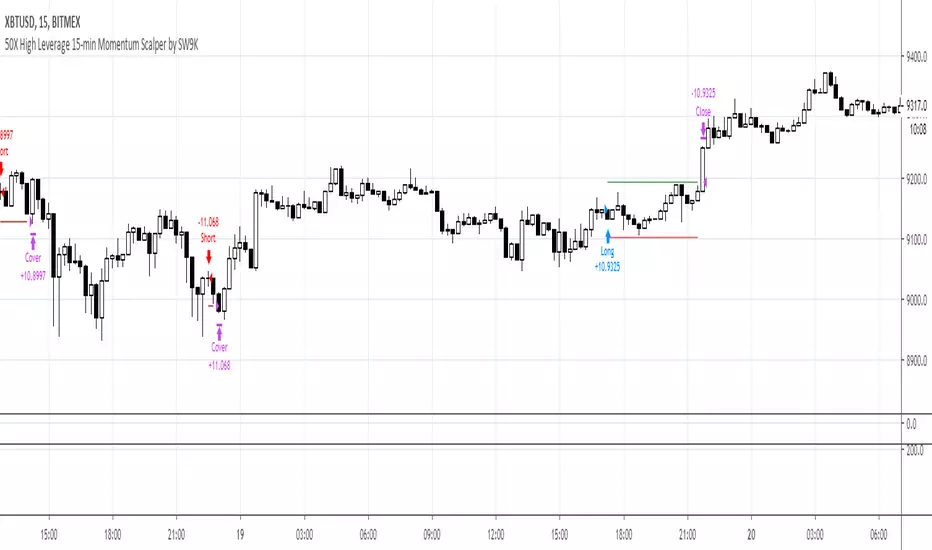
15MEX Momentum ScalperAlpha product project in development. Uses a combination of MACD and T3-CCI with tweaked settings to catch directional momentum and scalp a small move. Strategy is quantity of trades over quality of trades to build profits.
Use this strategy for 15-min Bitmex scalping on XBT contracts only. Recommend 100k contract size or less; backtested with 100k contracts.
Market enter, then use post-only limit exits and stop losses.
Setting is pre-optimized for 0.5% tp target and 0.5% sl of entry price. Recommend default 3 bars as basis for confirming recent MACD crossover as well as default 0.618 Fibonacci ratio as the T3-CCI basis.
Default risk level setting is approximately 2-3 trades a day. You can double the amount to 4-5 trades a day by enabling Aggressive mode. This may lead to larger profits and more entries, but with more frequent stop losses.
Future version will include trailing TPs/stops. Still undergoing optimization and refinement.
RePaNoCHa [Backtest]This is a very long script and adjusting the settings can be a bit slow so I share some settings. (these may be even better)
It has no security() and no Heikin Ashi so no repaint and Backtest is real.
It's important to adjust correctly the tics/pips correction.
All timeframes but good results at 2H
Default settings for ETHUSD (BITMEX) 2H
Alerts version coming soon...
Enjoy!!!
"Este script es la repanocha"
XBTUSD (BITMEX)
Timeframe = 2H
Position Side = BOTH
Source = hlc3
T3 == true
T3 Length = 8
T3 Volume Factor = 0.9
Range Filter+ADX == true
Sampling Period = 16
Range Multiplier = 1.3
Flat Market Trades == true
ADX lenght = 10
ADX Threshold = 20
Parabolic SAR == true
SAR start = 0.03
SAR inc = 0.02
SAR max = 0.3
Pyramiding = 15
Trailing Stop Activation % = 0.5
Trailing Stop Offset % (when profit=0.5 %) = 0.2
Trailing Stop Offset % (when profit=10 %) = 1.2
Stop Loss = 3.2
Tics/Pips Correction = 10
Initial Capital = 1000
Quantity = 100 %
Commission value = 0.075 %
ETHUSD (BITMEX)
Timeframe = 2H
Position Side = BOTH
Source = hlc3
T3 == true
T3 Length = 6
T3 Volume Factor = 0.7
Range Filter+ADX == true
Sampling Period = 10
Range Multiplier = 0.9
Flat Market Trades == true
ADX lenght = 11
ADX Threshold = 19
Parabolic SAR == true
SAR start = 0.06
SAR inc = 0.07
SAR max = 0.15
Pyramiding = 15
Trailing Stop Activation % = 0.5
Trailing Stop Offset % (when profit=0.5 %) = 0.25
Trailing Stop Offset % (when profit=10 %) = 1.5
Stop Loss = 3.2
Tics/Pips Correction = 100
Initial Capital = 1000
Quantity = 100 %
Commission value = 0.075 %
BNBUSDT (BINANCE)
Timeframe = 2H
Position Side = LONG
Source = hlc3
T3 == true
T3 Length = 6
T3 Volume Factor = 0.7
Range Filter+ADX == true
Sampling Period = 17
Range Multiplier = 1.3
Flat Market Trades == true
ADX lenght = 5
ADX Threshold = 18
Parabolic SAR == true
SAR start = 0.04
SAR inc = 0.03
SAR max = 0.25
Pyramiding = 15
Trailing Stop Activation % = 0.5
Trailing Stop Offset % (when profit=0.5 %) = 0.25
Trailing Stop Offset % (when profit=10 %) = 1.5
Stop Loss == false
Tics/Pips Correction = 10000
Initial Capital = 1000
Quantity = 100 %
Commission value = 0.075 %
LTCUSDT (BINANCE)
Timeframe = 2H
Position Side = LONG
Source = hlc3
T3 == true
T3 Length = 3
T3 Volume Factor = 1
Range Filter+ADX == true
Sampling Period = 11
Range Multiplier = 1.1
Flat Market Trades == true
ADX lenght = 6
ADX Threshold = 22
Parabolic SAR == true
SAR start = 0.07
SAR inc = 0.04
SAR max = 0.15
Pyramiding = 15
Trailing Stop Activation % = 0.5
Trailing Stop Offset % (when profit=0.5 %) = 0.25
Trailing Stop Offset % (when profit=10 %) = 1.5
Stop Loss == false
Tics/Pips Correction = 100
Initial Capital = 1000
Quantity = 100 %
Commission value = 0.075 %
TRXUSDT (BINANCE)
Timeframe = 2H
Position Side = LONG
Source = hlc3
T3 == true
T3 Length = 7
T3 Volume Factor = 1
Range Filter+ADX == true
Sampling Period = 8
Range Multiplier = 1.1
Flat Market Trades == true
ADX lenght = 4
ADX Threshold = 22
Parabolic SAR == true
SAR start = 0.07
SAR inc = 0.04
SAR max = 0.15
Pyramiding = 15
Trailing Stop Activation % = 0.5
Trailing Stop Offset % (when profit=0.5 %) = 0.25
Trailing Stop Offset % (when profit=10 %) = 1.5
Stop Loss == false
Tics/Pips Correction = 100000
Initial Capital = 1000
Quantity = 100 %
Commission value = 0.075 %
NAS100 (OANDA)
Timeframe = 2H
Position Side = BOTH
Source = hlc3
T3 == true
T3 Length = 3
T3 Volume Factor = 1
Range Filter+ADX == true
Sampling Period = 12
Range Multiplier = 1.3
Flat Market Trades == true
ADX lenght = 18
ADX Threshold = 21
Parabolic SAR == true
SAR start = 0.08
SAR inc = 0.06
SAR max = 0.25
Pyramiding = 15
Trailing Stop Activation % = 0.2
Trailing Stop Offset % (when profit=0.5 %) = 0.15
Trailing Stop Offset % (when profit=10 %) = 1
Stop Loss == false
Tics/Pips Correction = 10
Initial Capital = 1000
Quantity = 3 contracts
Commission value = 0.2 USD per contract
NATGAS(OANDA)
Timeframe = 2H
Position Side = BOTH
Source = hlc3
T3 == true
T3 Length = 3
T3 Volume Factor = 1
Range Filter+ADX == true
Sampling Period = 15
Range Multiplier = 1.3
Flat Market Trades == true
ADX lenght = 12
ADX Threshold = 21
Parabolic SAR == true
SAR start = 0.08
SAR inc = 0.06
SAR max = 0.4
Pyramiding = 15
Trailing Stop Activation % = 0.2
Trailing Stop Offset % (when profit=0.5 %) = 0.15
Trailing Stop Offset % (when profit=10 %) = 1
Stop Loss == false
Tics/Pips Correction = 1000
Initial Capital = 1000
Quantity = 4500 contracts
Commission value = 0.002 USD per contract
SPX500 (OANDA)
Timeframe = 2H
Position Side = BOTH
Source = hlc3
T3 == true
T3 Length = 4
T3 Volume Factor = 0.8
Range Filter+ADX == true
Sampling Period = 14
Range Multiplier = 1.3
Flat Market Trades == true
ADX lenght = 12
ADX Threshold = 17
Parabolic SAR == true
SAR start = 0.09
SAR inc = 0.04
SAR max = 0.2
Pyramiding = 15
Trailing Stop Activation % = 0.15
Trailing Stop Offset % (when profit=0.5 %) = 0.1
Trailing Stop Offset % (when profit=10 %) = 0.5
Stop Loss = 1.5
Tics/Pips Correction = 10
Initial Capital = 1000
Quantity = 8 contracts
Commission value = 0.2 USD per contract
US30 (OANDA)
Timeframe = 2H
Position Side = BOTH
Source = hlc3
T3 == true
T3 Length = 4
T3 Volume Factor = 0.9
Range Filter+ADX == true
Sampling Period = 11
Range Multiplier = 1.1
Flat Market Trades == true
ADX lenght = 16
ADX Threshold = 24
Parabolic SAR == true
SAR start = 0.08
SAR inc = 0.03
SAR max = 0.05
Pyramiding = 15
Trailing Stop Activation % = 0.15
Trailing Stop Offset % (when profit=0.5 %) = 0.075
Trailing Stop Offset % (when profit=10 %) = 0.5
Stop Loss = 1.5
Tics/Pips Correction = 10
Initial Capital = 1000
Quantity = 1 contracts
Commission value = 1.5 USD per contract
WHEAT (OANDA)
Timeframe = 2H
Position Side = BOTH
Source = hlc3
T3 == true
T3 Length = 3
T3 Volume Factor = 1.1
Range Filter+ADX == true
Sampling Period = 12
Range Multiplier = 0.9
Flat Market Trades == true
ADX lenght = 13
ADX Threshold = 21
Parabolic SAR == true
SAR start = 0.1
SAR inc = 0.05
SAR max = 0.15
Pyramiding = 15
Trailing Stop Activation % = 0.2
Trailing Stop Offset % (when profit=0.5 %) = 0.1
Trailing Stop Offset % (when profit=10 %) = 1
Stop Loss = 2.5
Tics/Pips Correction = 1000
Initial Capital = 1000
Quantity = 2500 contracts
Commission value = 0.003 USD per contract

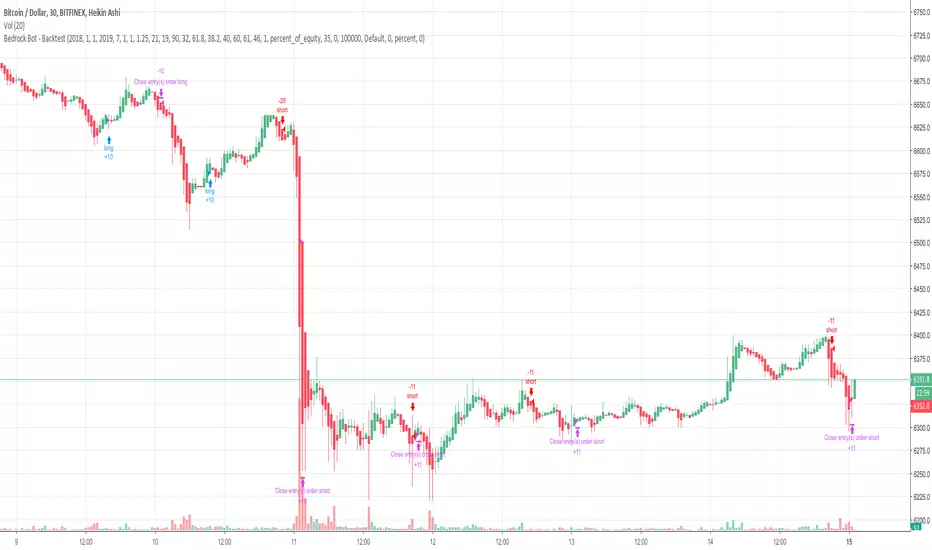
Bedrock Bot - BTCUSD 30m Scalper BotBedrock Bot trades on BTCUSD charts and is a high frequency scalper bot - for those that like a little more action.
The strategy was developed for use on more recent market conditions - smaller trends within larger sideways ranges. It will work in trends as well. It is made for quick take profits and tight stop losses to maximize overall profit and minimize losses (check out the win ratio and downdraw results). It does not trade on the weekends as much of the volume is now weekday based.
Backtest results look great and we have been running this bot on live markets as well in forward testing with profit results.
These live tests were done exclusively on BitMex and by using automation on Crypto Bots Hub . Monthly returns have been around 8% - you may think this doesn't sound amazing but understand compound interest and do check out the win percentage and downdraw. In these sideways markets, this can keep building your profits slow and steady with minimal risk.
The bot controls entries, stop losses, and take profits as part of the code.
Message me on information to get free access.
cryptomars 1.0 signal Concussion trend
Description:
1. In the indicator, there is an orange signal that fluctuates linearly. It is a buy signal when it goes from bottom to top. When the signal line remains in the upper position, it indicates a multi-party trend.
2. When it goes from top to bottom, it indicates a sell signal. When the signal line remains below, it indicates a sales trend.
3. Depending on the time level, when the position of the signal line changes, determine whether the current candle is completed or not according to the time level of the chart you selected to determine the signal. For example, if you select a chart level of 5 meters, then when the signal line changes, for example, it will send a sell signal from top to bottom. At this time, please do not rush to sell. You should wait for this 5 meter candlestick to complete. When the candle is over and the next candle is started, if the signal line remains in the top-down form, the sell signal is normal and you can sell it.
Because the position of the signal appears, it is the location of the sale. During the completion of the candlestick , the signal may disappear after disappearing. We only have to wait for a while to get a more stable deal.
4. The alarm setting is very simple. There are two lines in the indicator. One is the orange signal line that fluctuates up and down, and the other is the fixed zero line of “zero”.
We set it in the alarm. When the signal line passes "zero" from the top, the short signal is sent only when the candle map is completed. When the signal line passes "zero" from "up" below, the signal is sent for a long time when the candlestick is completed.
One trick, the appearance of the signal, is that the price runs in one direction for a while, so it appears at or near the bottom. Because, when we have already made a profit in the transaction, we can make a profit in advance, and we do not need to wait for the opposite signal to stop the profit and reduce the risk of profit retracement.
Because in this market, the fluctuations are very large, and the people who compete are also very fierce. What we need to do is to make every transaction as possible, and we are all profitable. If we sell and find that the price is still rising, please don't feel sorry, don't consider eating all the profits.
6. When the signal appears, in most cases, even in the impact trend, it will still run a distance in the direction of the signal, that is, you will profit, so please close the position and make a profit in time. Otherwise, when the price volatility is too small, you miss the profit point, the price starts to run in the opposite direction, and you may change from profit to loss.
BITMEX's trailing stop loss is a great feature, please use it flexibly.
7, if it is a shock trend, please try not to trade.
8. We recommend that you turn on the “cryptomars 3.0” and “cryptomars 2.0” indicators. No matter who signs the trade first, you can trade, which can help you get more profit.
9. Remember, I hope this indicator will be your powerful assistant, but please don't rely on it completely. Learning more trading knowledge and skills is even more important. Therefore, when we consider the profitable position, you can use your trading skills, MACD , KDJ, etc. to assist and profit in a more suitable position.

cryptomars signal short 2.0Description:
1. In the indicator, there is an orange signal that fluctuates linearly. It is a buy signal when it goes from bottom to top. When the signal line remains in the upper position, it indicates a multi-party trend.
2. When it goes from top to bottom, it indicates a sell signal. When the signal line remains below, it indicates a sales trend.
3. Depending on the time level, when the position of the signal line changes, determine whether the current candle is completed or not according to the time level of the chart you selected to determine the signal. For example, if you select a chart level of 5 meters, then when the signal line changes, for example, it will send a sell signal from top to bottom. At this time, please do not rush to sell. You should wait for this 5 meter candlestick to complete. When the candle is over and the next candle is started, if the signal line remains in the top-down form, the sell signal is normal and you can sell it.
Because the position of the signal appears, it is the location of the sale. During the completion of the candlestick , the signal may disappear after disappearing. We only have to wait for a while to get a more stable deal.
4. The alarm setting is very simple. There are two lines in the indicator. One is the orange signal line that fluctuates up and down, and the other is the fixed zero line of “zero”.
We set it in the alarm. When the signal line passes "zero" from the top, the short signal is sent only when the candle map is completed. When the signal line passes "zero" from "up" below, the signal is sent for a long time when the candlestick is completed.
One trick, the appearance of the signal, is that the price runs in one direction for a while, so it appears at or near the bottom. Because, when we have already made a profit in the transaction, we can make a profit in advance, and we do not need to wait for the opposite signal to stop the profit and reduce the risk of profit retracement.
Because in this market, the fluctuations are very large, and the people who compete are also very fierce. What we need to do is to make every transaction as possible, and we are all profitable. If we sell and find that the price is still rising, please don't feel sorry, don't consider eating all the profits.
6. When the signal appears, in most cases, even in the impact trend, it will still run a distance in the direction of the signal, that is, you will profit, so please close the position and make a profit in time. Otherwise, when the price volatility is too small, you miss the profit point, the price starts to run in the opposite direction, and you may change from profit to loss.
BITMEX's trailing stop loss is a great feature, please use it flexibly.
7, if it is a shock trend, please try not to trade.
8. We recommend that you turn on the “cryptomars 3.0” and “cryptomars 1.0” indicators. No matter who signs the trade first, you can trade, which can help you get more profit.
9. Remember, I hope this indicator will be your powerful assistant, but please don't rely on it completely. Learning more trading knowledge and skills is even more important. Therefore, when we consider the profitable position, you can use your trading skills, MACD , KDJ, etc. to assist and profit in a more suitable position.

cryptomars signal 3.0Description:
1. In the indicator, there is an orange signal that fluctuates linearly. It is a buy signal when it goes from bottom to top. When the signal line remains in the upper position, it indicates a multi-party trend.
2. When it goes from top to bottom, it indicates a sell signal. When the signal line remains below, it indicates a sales trend.
3. Depending on the time level, when the position of the signal line changes, determine whether the current candle is completed or not according to the time level of the chart you selected to determine the signal. For example, if you select a chart level of 5 meters, then when the signal line changes, for example, it will send a sell signal from top to bottom. At this time, please do not rush to sell. You should wait for this 5 meter candlestick to complete. When the candle is over and the next candle is started, if the signal line remains in the top-down form, the sell signal is normal and you can sell it.
Because the position of the signal appears, it is the location of the sale. During the completion of the candlestick , the signal may disappear after disappearing. We only have to wait for a while to get a more stable deal.
4. The alarm setting is very simple. There are two lines in the indicator. One is the orange signal line that fluctuates up and down, and the other is the fixed zero line of “zero”.
We set it in the alarm. When the signal line passes "zero" from the top, the short signal is sent only when the candle map is completed. When the signal line passes "zero" from "up" below, the signal is sent for a long time when the candlestick is completed.
One trick, the appearance of the signal, is that the price runs in one direction for a while, so it appears at or near the bottom. Because, when we have already made a profit in the transaction, we can make a profit in advance, and we do not need to wait for the opposite signal to stop the profit and reduce the risk of profit retracement.
Because in this market, the fluctuations are very large, and the people who compete are also very fierce. What we need to do is to make every transaction as possible, and we are all profitable. If we sell and find that the price is still rising, please don't feel sorry, don't consider eating all the profits.
6. When the signal appears, in most cases, even in the impact trend, it will still run a distance in the direction of the signal, that is, you will profit, so please close the position and make a profit in time. Otherwise, when the price volatility is too small, you miss the profit point, the price starts to run in the opposite direction, and you may change from profit to loss.
BITMEX's trailing stop loss is a great feature, please use it flexibly.
7, if it is a shock trend, please try not to trade.
8. We recommend that you turn on the “cryptomars 2.0” and “cryptomars 1.0” indicators. No matter who signs the trade first, you can trade, which can help you get more profit.
9. Remember, I hope this indicator will be your powerful assistant, but please don't rely on it completely. Learning more trading knowledge and skills is even more important. Therefore, when we consider the profitable position, you can use your trading skills, MACD , KDJ, etc. to assist and profit in a more suitable position.

Bollinger + RSI, Double Strategy (by ChartArt)Bollinger Bands + RSI, Double Strategy
This strategy uses a slower RSI with period 16 to sell when the RSI increases over the value of 55 (or to buy when the value falls below 45), with the classic Bollinger Bands strategy to sell when the price is above the upper Bollinger Band and falls below it (and to buy when the price is below the lower band and rises above it). This strategy only triggers when both the RSI and the Bollinger Bands indicators are at the same time in the described overbought or oversold condition. In addition there are color alerts which can be deactivated.
This basic strategy is based upon the "RSI Strategy" and "Bollinger Bands Strategy" which were created by Tradingview and uses no money management like a trailing stop loss and no scalping methods. Every win/loss trade is simply counted from the last overbought/oversold condition to the next one.
This strategy does not use close prices from higher-time frame and should not repaint after the current candle has closed. It might repaint like every Tradingview indicator while the current candle hasn't closed.
All trading involves high risk; past performance is not necessarily indicative of future results. Hypothetical or simulated performance results have certain inherent limitations. Unlike an actual performance record, simulated results do not represent actual trading. Also, since the trades have not actually been executed, the results may have under- or over-compensated for the impact, if any, of certain market factors, such as lack of liquidity. Simulated trading programs in general are also subject to the fact that they are designed with the benefit of hindsight. No representation is being made that any account will or is likely to achieve profits or losses similar to those shown.

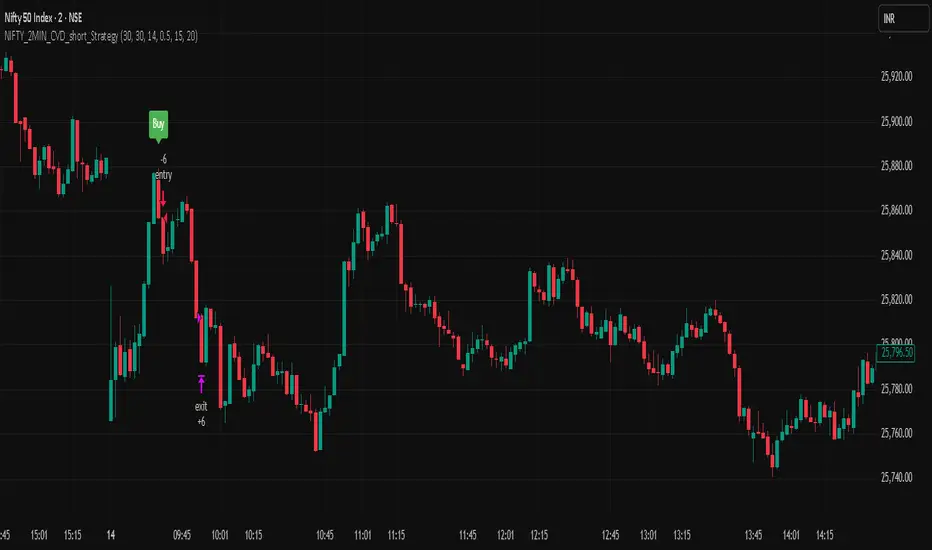
NIFTY_2MIN_CVD_short_StrategySummary
This strategy is an intraday system designed for the Nifty index on a 2-minute timeframe, focusing exclusively on identifying high-probability short (sell) entries. It utilizes a combination of rapid price action and Cumulative Volume Delta (CVD) to detect "Buying Absorption" at local peaks.
Concept & Core Logic
The strategy is engineered to identify "Inverted V-shaped" reversals where aggressive buying pressure is exhausted and absorbed by large-scale limit orders from sellers.
Price Action Trigger: The strategy looks for a specific two-part sequence:
Sudden Bullish Movement: A rapid upward move that often traps late buyers or triggers short-covering.
Sudden Reversal: Immediately followed by a strong, high-momentum bearish (red) candle, signaling a swift rejection of the higher prices.
CVD Absorption Filter: To confirm the validity of the reversal, the strategy analyzes the Cumulative Volume Delta (CVD). It identifies instances where the relative movement of the CVD is significantly higher than the corresponding price movement. This specific divergence highlights "Buying Absorption"—a market condition where aggressive market buy orders are being filled by passive limit sell orders, preventing further price appreciation and creating a heavy ceiling for the reversal.
Risk Management
To maintain a disciplined approach, the strategy employs fixed exit parameters based on the underlying Nifty price:
Take Profit: 25 points.
Stop Loss: 30 points.
Intended Use
This tool is intended for traders who study mechanical, rule-based systems and order flow dynamics. It provides a structured framework for observing how volume delta divergence (CVD) and rapid price rejections interact at potential market turning points.
Disclaimer: This script is for educational and informational purposes only. It is not financial advice. All trading involves risk, and past performance is not indicative of future results. Please conduct your own research and backtesting before making any trading decisions.
NIFTY_2MIN_CVD_Absorption_long_StrategySummary
This strategy is an intraday system designed for the Nifty index on a 2-minute timeframe, focusing on high-probability reversal entries. It utilizes price action patterns and Cumulative Volume Delta (CVD) to identify market turning points.
Long Strategy: Concept & Core Logic
The long strategy is engineered to identify "V-shaped" recoveries where selling pressure is exhausted and absorbed by aggressive buyers.
Price Action Trigger: The strategy looks for a specific two-part sequence:
Sudden Bearish Movement: A rapid downward move representing a final flush of sellers.
Sudden Reversal: Immediately followed by a strong, high-momentum bullish (green) candle, indicating a swift change in market sentiment.
CVD Absorption Filter: To confirm the validity of the reversal, the strategy analyzes the Cumulative Volume Delta (CVD). It specifically looks for instances where the relative movement of CVD is significantly higher than the corresponding price movement. This divergence suggests "selling absorption"—where large buy orders are soaking up sell-side liquidity, creating a floor for the reversal.
Risk Management (Long)
The strategy utilizes fixed exit parameters based on the underlying Nifty price points:
Take Profit: 25 points.
Stop Loss: 30 points.
Intended Use
This tool is intended for traders who study mechanical, rule-based systems. It demonstrates how price action, volume delta divergence (CVD), and trend filters can be combined to time entries in both trending and reversal market conditions.
Disclaimer: This script is for educational and informational purposes only. It is not financial advice. All trading involves risk, and past performance is not indicative of future results. Please conduct your own research and backtesting before making any trading decisions.

Nifty_2MIN_Rangereversal_Short_StrategySummary
This strategy is an intraday trend-following system designed for the Nifty index on a 2-minute timeframe, focusing exclusively on short (sell) entries. It is engineered to identify failed bounces within established bearish trends.
Concept & Core Logic
The strategy uses a multi-layered approach to confirm downward momentum before triggering an entry:
Trend Confirmation: The script analyzes the slope and positioning of the 20-period and 200-period Exponential Moving Averages (EMA). Short signals are only valid when the EMA configuration confirms a prevailing bearish trend.
Retracement Zone Filtering: To optimize entry pricing, the strategy monitors the daily price range. It looks for the market to be within the 35% to 75% range of the day's movement, specifically identifying a temporary upward "relief rally" or bounce after a significant fall.
Candlestick Trigger: The execution occurs when a specific bearish reversal pattern appears during the relief rally:
Two consecutive bullish candles (representing the temporary bounce).
Followed by a strong, high-momentum bearish candle (signaling the resumption of the primary downtrend).
Risk Management
The strategy utilizes fixed exit parameters based on the underlying Nifty price points:
Take Profit: 28 points.
Stop Loss: 30 points.
Intended Use
This tool is intended for traders who study mechanical, rule-based systems. It demonstrates how moving average trends can be combined with range analysis and price action sequences to time entries during market retracements.
Disclaimer: This script is for educational and informational purposes only. It is not financial advice. All trading involves risk, and past performance is not indicative of future results. Please conduct your own research and backtesting before making any trading decisions.

Nifty_2MIN_ Rangereversal_Long _StrategySummary
This strategy is an intraday trend-following system designed for the Nifty index on a 2-minute timeframe. It focuses exclusively on long entries, seeking to identify high-probability recovery points within an established uptrend.
Concept & Core Logic
The strategy identifies entries based on a confluence of trend direction, price recovery levels, and specific candlestick patterns:
Trend Confirmation: The script utilizes the slope and positioning of the 20-period and 200-period Exponential Moving Averages (EMA). A long signal is only considered when the trend is determined to be positive, ensuring trades align with the broader market momentum.
Recovery Zone Filtering: To avoid buying at local peaks, the strategy filters for entries that occur when the market has retraced but is showing signs of recovery. Specifically, it looks for price to be within the 35% to 75% recovery range relative to the day's high.
Candlestick Trigger: The actual entry trigger is a "Bullish Reversal" sequence:
Two consecutive bearish candles (representing a minor pullback).
Followed immediately by a strong bullish candle (representing the resumption of strength).
Risk Management
The strategy uses fixed point-based exits to maintain a disciplined approach:
Take Profit: 30 points (underlying Nifty price).
Stop Loss: 35 points (underlying Nifty price).
Intended Use
This script is designed for traders interested in mechanical trend-following systems. It provides a structured way to observe how moving average slopes and specific price action sequences interact during intraday recoveries.
Disclaimer: This script is for educational and informational purposes only. It is not financial advice. All trading involves risk, and past performance is not indicative of future results. Please conduct your own research and backtesting before making any trading decisions.

Improved Candle Strategy (without daily squared)# Candle Pattern Trading Strategy
## Core Logic
Analyzes the last 5 candlesticks to identify "close at high" and "close at low" patterns, generating long/short signals.
## Trading Conditions
- **Long**: ≥2 bars closed at high in past 5 bars + current bar closes at high → Open long
- **Short**: ≥2 bars closed at low in past 5 bars + current bar closes at low → Open short
- **Filter**: If ≥3 doji patterns detected, skip trading
## Risk Management
- Stop Loss: Based on entry bar's high/low
- Take Profit: Risk × 2x multiplier
- Cooldown: No trading for 2 bars after entry
- Session Filter: No trading for first 5 bars after market open
## Configurable Parameters
- Lookback period, doji threshold, close proximity ratio, TP/SL ratio, cooldown bars, etc.
**Use Cases**: 1-minute and higher timeframes on stocks/futures

Daily Dynamic Grid StrategyHi everyone,
This strategy is built around a dynamic daily grid concept, using an upper and lower daily range that is automatically divided into multiple grid levels.
The idea is to take advantage of daily volatility by executing DCA entries on specific grid levels, based on predefined conditions.
Key points of the strategy & feature:
I recommend using 1H or 2H timeframe for this strategy
Take profit by grid
When DCA is active (>1 entry), the exit condition switches to close above the average price
A hard stop loss is applied
Includes an optional Trailing TP / SL to help maximize profit during strong moves
Like most DCA-based strategies, it tends to have a high win rate, but during strong market dumps, losses can become relatively large
Can also be used for backtest on Forex markets such as Gold, where using the trailing option is generally more effective
And still trial for the webhook, may continue to improve and update this strategy in future versions.

Scalping EMA + Pinbar Strategy (London & NY only, BE @ 1R)The scalping trading system uses two types of indicators:
EMA 10, EMA 21, EMA 50
Pinbar Indicator
Rules for entering a buy order:
If the closing price is above the EMA 50, the trend is uptrend and only buy orders should be considered.
The EMA 10 and EMA 21 lines must simultaneously be above the EMA 50.
The price must correct down at least 50% of the area created by the EMA 10 and EMA 21, or correct further down.
A Type 1 Pinbar candle (marked by the Pinbar indicator) must appear; this Pinbar candle must react to at least one of the three EMA lines (EMA 10, EMA 21, EMA 50) and close above the EMA 50.
This Pinbar candle must have a Pinbar strength value (marked by the Pinbar indicator) less than 2 to be considered valid. Check if the closing price of this pinbar candle is higher than the 50-day EMA and if the 10-day and 21-day EMAs are also higher than the 50-day EMA. If so, the conditions have been met and you can begin trading.
Place a buy stop order 0.1 pip higher than the highest price of the pinbar candle, and a stop loss order 0.1 pip lower than the lowest price of the pinbar candle. Set the take profit at 3R.
If the price moves past the previously set stop loss, cancel the pending order.
When the price moves 1R, move the stop loss back to the entry point.
The next trade can only be executed after the previous trade has moved the stop loss back to the entry point.
Rules for placing sell orders:
If the closing price is below the 50-day EMA, the trend is bearish, and only sell orders should be considered. The 10-day and 21-day EMAs must both be below the 50-day EMA.
The price must correct downwards by at least 50% of the area formed by the 10-day and 21-day EMAs, or even further.
A Type 1 pinbar candle (marked by the Pinbar indicator) must appear. This pinbar candle must react to at least one of the three EMAs (EMA 10, EMA 21, EMA 50) and close below the EMA 50.
This pinbar is valid if its strength (indicated by the Pinbar indicator) is less than 2. Verify that the closing price of this pinbar candle is below the EMA 50 and that both the EMA 10 and EMA 21 are below the EMA 50. If all conditions are met, the trade can be executed.
(This appears to be a separate entry rule and not part of the previous text.) Place a sell stop order 0.1 pip below the lowest point of the pinbar candle, and a stop loss order 0.1 pip above the highest point of the pinbar candle. Set the take profit point at 3R.
If the price moves past the previously set stop-loss point, cancel the pending order.
When the price moves 1R, move the stop-loss point back to the entry point.
The next trade can only be executed after the previous trade has moved the stop-loss point back to the entry point.

DR/IDR Break .5 TPDR/IDR Extension Breakout with Custom Stop
This strategy is a systematic, counter-trend, and momentum-based system designed for intraday trading. It operates on the principle of an Opening Range Breakout (ORB), utilizing the initial market consolidation to project high-probability targets, while offering multiple methods for managing risk.
1. Market Identification (The Opening Range)
The strategy begins by defining the market's initial boundaries and volatility:
Session Window: The strategy calculates the Opening Range (OR) over a user-defined time period (default: 9:30 AM to 10:30 AM New York Time).
ORB Levels: Two key price levels are established and locked once the time window closes:
Wick High/Low: The absolute highest and lowest prices of the session. These serve as the entry trigger lines.
Body High/Low (Shaded Range): The highest and lowest open/close prices of the session. The height of this range is used to calculate the Take Profit and Stop Loss levels.
2. Entry Rule (The Breakout)
The strategy is passive until the range is violated, looking for a strong move out of the consolidation area.
Trigger Condition: A trade is signaled when a candle closes either:
Above the Wick High (for a Long entry).
Below the Wick Low (for a Short entry).
Execution: The entry is a Market Order executed on the candle that meets the trigger condition, subject to a user-defined Entry Delay (default 0 bars, meaning the entry is taken immediately upon the breakout candle's close).
Direction Control: The user can select to trade Long Only, Short Only, or Both.
3. Exit and Risk Management
All trades are placed with simultaneous Take Profit and Stop Loss orders (a bracket order) once the entry is filled.
A. Take Profit (TP)
The Take Profit is set at the 0.5 Extension of the Shaded Range (Body Range).
Calculation: The distance from the Body High/Low to the TP level is exactly 50% of the total height of the Shaded Range.
B. Stop Loss (SL)
The Stop Loss is dynamically calculated based on a user-selected method for risk control:
Range 0.5 (Body Range): The Stop Loss is placed an equal distance (0.5 times the Body Range height) outside the opposite side of the Body Range.
Example (Long): If entry is above the Wick High, the SL is set 0.5 times the Body Range height below the Body Low.
ATR Multiple: The Stop Loss distance is determined by the asset's recent volatility.
Calculation: The distance is calculated as a user-defined Multiplier (default 2.0) times the Average True Range (ATR).
Recent Swing Low/High: The Stop Loss is placed based on a structural level defined by recent price action.
Long Entry: SL is placed at the Lowest Swing Low within a user-defined lookback period.
Short Entry: SL is placed at the Highest Swing High within a user-defined lookback period.
Summary of Workflow
The market sets the Wick and Body boundaries (e.g., 9:30–10:30 AM).
Price breaks and closes beyond a Wick boundary, triggering a signal.
The trade enters after the specified delay.
A bracket order is placed: TP is fixed at the 0.5 Extension, and SL is set based on the user's chosen risk method.
The trade is closed upon reaching either the TP or the SL level.
